Chart examples
chart-examples.Rmdbar chart
# example data shipped with the package
cjs_example_data('bar')
#>   letters numbers group
#> 1       A       2    g1
#> 2       B       7    g1
#> 3       C       5    g1
#> 4       D       3    g1
#> 5       E       1    g1
A simple call. We often need to build further from here.
cjs_example_data('bar') %>%
  chartjs(type = 'bar', x = letters, y = numbers)
# Multiple groups in data
cjs_example_data('bar', grouped = TRUE) %>%
  chartjs(type = 'bar', x = letters, y = numbers, group = group)
Adding axis and themes.
cjs_example_data('bar') %>%
  chartjs(type = 'bar', x = letters, y = numbers) %>%
  cjs_scale_cartesian(id = 'y', title.text = 'count',
                      ticks = cjs_ticks(callback = ticks_integer_callback(step = 1))) %>%
  cjs_scale_category(id = 'x', labels = LETTERS[c(5,2,3,4,1)],
                     grid = cjs_grid(display = FALSE)) %>%
  cjs_theme(title.text = 'A Chart.js plot', legend.position = 'none')
Adding datasets.
cjs_example_data('bar') %>%
  chartjs() %>%
  cjs_add_bars(x = letters, y = numbers, label = 'from source data') %>%
  cjs_add_bars(x = LETTERS[1:5], y = 5:1, label = 'from vectors') %>%
  cjs_add_bars(x = x1, y = y1, label = 'from given data',
               data = data.frame(x1 = LETTERS[c(5,1,4,2,3)], y1 = 1:5)) %>%
  cjs_scale_color(backgroundColors = c('#181E20', '#045C94','#FFBB1C'))
Stacking dataset sets - stacked bar plot
cjs_example_data('bar') %>%
  chartjs() %>%
  cjs_add_bars(x = letters, y = numbers, label = 'from source data') %>%
  cjs_add_bars(x = LETTERS[1:5], y = 5:1, label = 'from vectors') %>%
  cjs_add_bars(x = x1, y = y1, label = 'from given data',
               data = data.frame(x1 = LETTERS[1:5], y1 = rpois(5,5))) %>%
  cjs_scale_color(backgroundColors = c('#181E20', '#045C94','#FFBB1C')) %>%
  cjs_stack_bars()
Horizontal bar plot
cjs_example_data('bar') %>%
  chartjs(type = 'bar') %>%
  cjs_add_bars(x = letters, y = numbers, colors = palette()[1:5]) %>%
  cjs_bar_orientation('horizontal')
Date axis - note uses formatting of https://date-fns.org/ … https://date-fns.org/v2.29.3/docs/format
cjs_example_data('scatter') %>%
  chartjs() %>%
  cjs_add_bars(x = x_time, y = y_numbers) %>%
  cjs_scale_datetime(id = 'x', time.unit = 'day')
cjs_example_data('scatter') %>%
  chartjs() %>%
  cjs_add_bars(x = x_time, y = y_numbers) %>%
  cjs_scale_datetime(id = 'x', time.unit = 'day', time.displayFormats = 'dd/MM/yyyy')
# expands data
cjs_example_data('scatter') %>%
  ggplot() +
  geom_col(aes(x = x_time, y = y_numbers))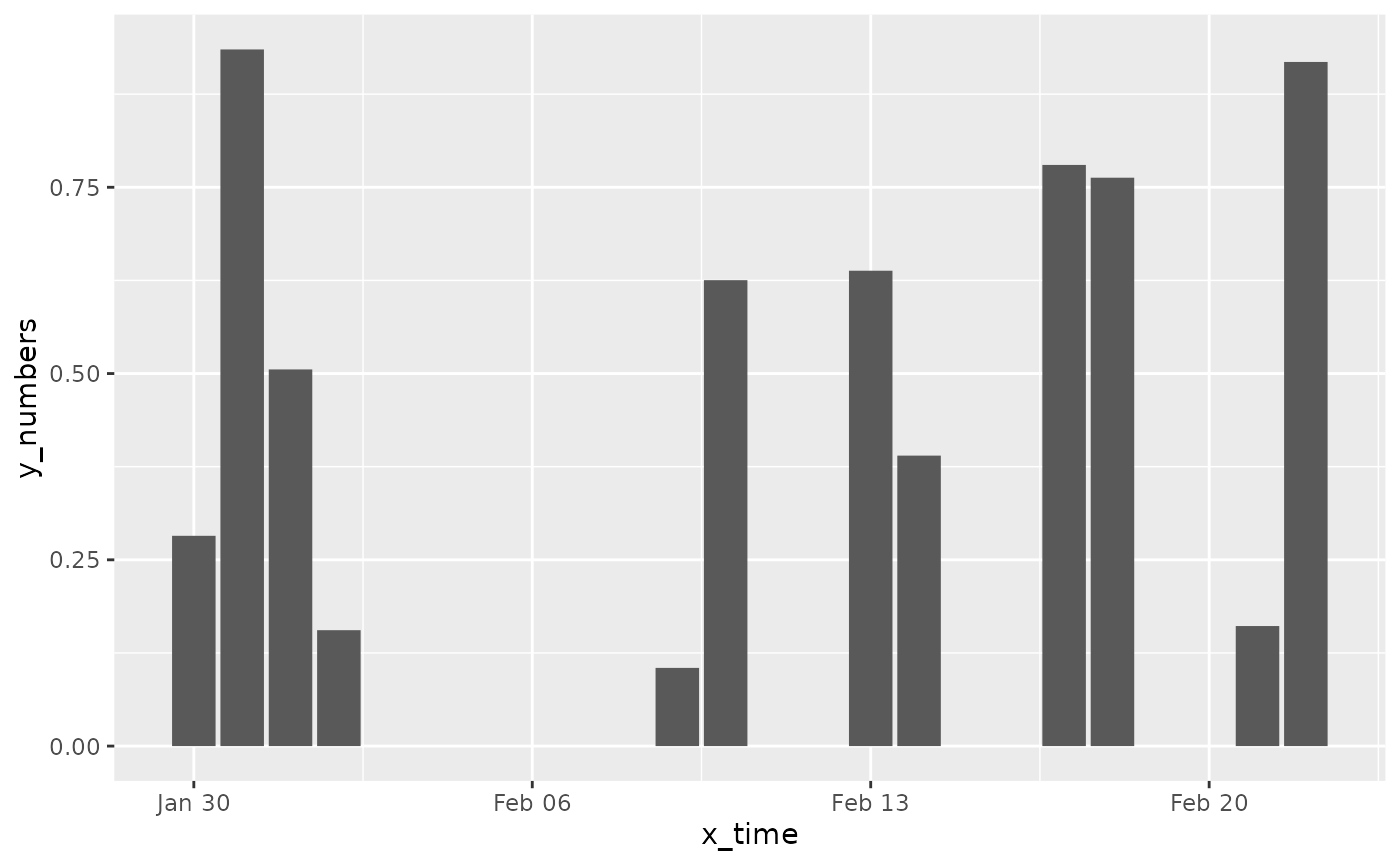
scatter chart
# example data shipped with the package
cjs_example_data('scatter')
#>      x_numbers     x_time  y_numbers group
#> 1  0.995123026 2024-10-31 0.88772342    g1
#> 2  0.710971250 2024-10-26 0.82801442    g1
#> 3  0.214942596 2024-11-03 0.10065646    g1
#> 4  0.291757630 2024-10-29 0.90605158    g1
#> 5  0.721759729 2024-11-01 0.77273036    g1
#> 6  0.866615703 2024-11-07 0.38337067    g1
#> 7  0.238453106 2024-10-24 0.99965246    g1
#> 8  0.004496308 2024-10-17 0.34929905    g1
#> 9  0.943516464 2024-10-18 0.94731827    g1
#> 10 0.438137200 2024-10-27 0.21609998    g1
#> 11 0.750603328 2024-10-20 0.03209271    g1
#> 12 0.667815764 2024-10-28 0.14531584    g1
Call with axes specs.
cjs_example_data('scatter') %>%
  chartjs(type = 'scatter', x = x_numbers, y = y_numbers) %>%
  # fix documentation of these
  cjs_scale_cartesian(id = 'y', title.text = 'Numbers on Y',
                      min = -0.2, max = 1.2) %>%
  cjs_scale_cartesian(id = 'x', title.text = 'Numbers on X',
                      min = -0.2, max = 1.2)
Adding datasets and colouring
cjs_example_data('scatter') %>%
  chartjs() %>%
  cjs_add_points(x = x_numbers, y = y_numbers, label = 'from source data') %>%
  cjs_add_points(x = runif(12), y = runif(12), label = 'from vectors') %>%
  cjs_add_points(x = x1, y = y1, label = 'from given data',
                 data = data.frame(x1 = runif(12), y1 = runif(12))) %>%
  cjs_scale_color(backgroundColors = palette()[1:3])
Adding a line to the points
cjs_example_data('scatter') %>%
  chartjs() %>%
  cjs_add_points(x = x_numbers, y = y_numbers, label = 'a', show_line = TRUE)
# arranges data
cjs_example_data('scatter') %>%
  ggplot(aes(x = x_numbers, y = y_numbers)) +
  geom_point() +
  geom_line()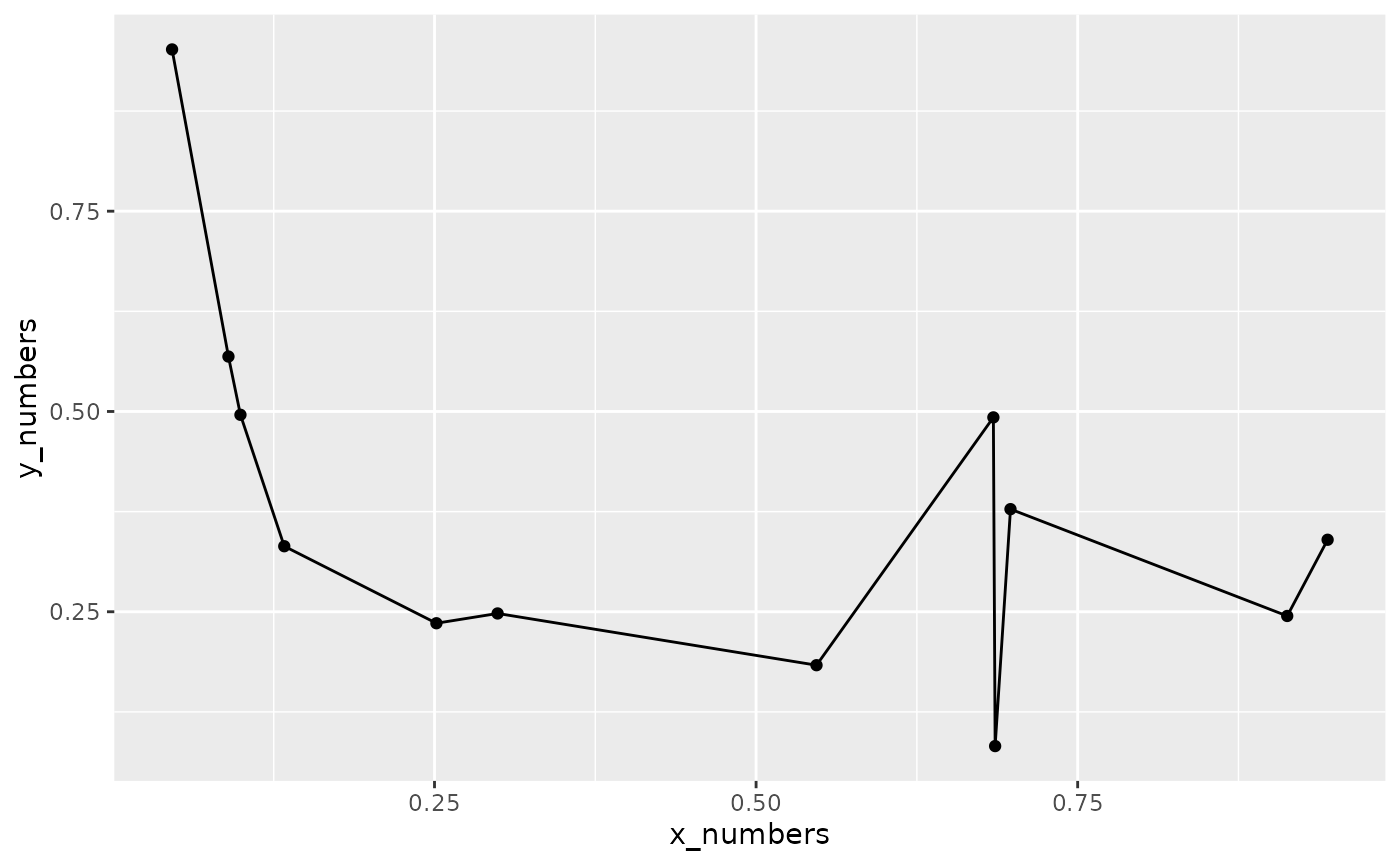
Point shape and sizes
unlist(cjs_shapes)
#>        circle         cross      crossRot          dash          line
#>      "circle"       "cross"    "crossRot"        "dash"        "line"
#>          rect   rectRounded       rectRot          star      triangle
#>        "rect" "rectRounded"     "rectRot"        "star"    "triangle"
#>         false
#>       "FALSE"

cjs_example_data('scatter') %>%
  chartjs() %>%
  cjs_add_points(x = x_numbers, y = y_numbers, label = 'a') %>%
  cjs_add_points(x = runif(12), y = runif(12), label = 'b') %>%
  cjs_add_points(x = x1, y = y1, label = 'c', data = data.frame(x1 = runif(12), y1 = runif(12))) %>%
  cjs_scale_color(backgroundColors = c(a = '#181E20', b = '#045C94', c = '#FFBB1C'), match_background_and_border = T) %>%
  cjs_scale_shape(pointStyles = c(cjs_shapes$circle, 'cross', cjs_shapes[['star']])) %>%
  cjs_scale_size(pointRadii = c(5,10,2))
Doughnut and pie charts
Doughnut and pie fit in the same realm - doughnut_pie
with a type= parameter
cjs_example_data('doughnut_pie')
#>   letters numbers group
#> 1       A       4    g1
#> 2       B       6    g1
#> 3       C       8    g1
#> 4       D       1    g1
#> 5       E       5    g1
Doughnut
cjs_example_data('doughnut_pie') %>%
  chartjs() %>%
  cjs_add_doughnut_pie(type = 'doughnut', x = letters, y = numbers)
Can stack .. needs work/QA
cjs_example_data('doughnut_pie') %>%
  chartjs() %>%
  cjs_add_doughnut_pie(type = 'doughnut', x = letters, y = numbers) %>%
  cjs_add_doughnut_pie(type = 'doughnut', x = LETTERS[1:5], y = 1:5)
Pie
cjs_example_data('doughnut_pie') %>%
  chartjs() %>%
  cjs_add_doughnut_pie(type = 'pie', x = letters, y = numbers, colors = palette()[1:5])
cjs_theme
Needs work
cjs_example_data('bar') %>%
  chartjs(type = 'bar', x = letters, y = numbers) %>%
  cjs_theme(chart.backgroundColor = 'pink',
            title.text = 'A pink chart',
            legend.position = 'right')